Repairs Performance Report
The information below provides an overview of housing repairs performance and tenant satisfaction, comparing April to September 2025 with the same period in 2024.
Repairs performance
| Repairs performance indicator |
April 2024 to September 2024 (%) |
April 2025 to Setpember 2025 (%) |
|---|---|---|
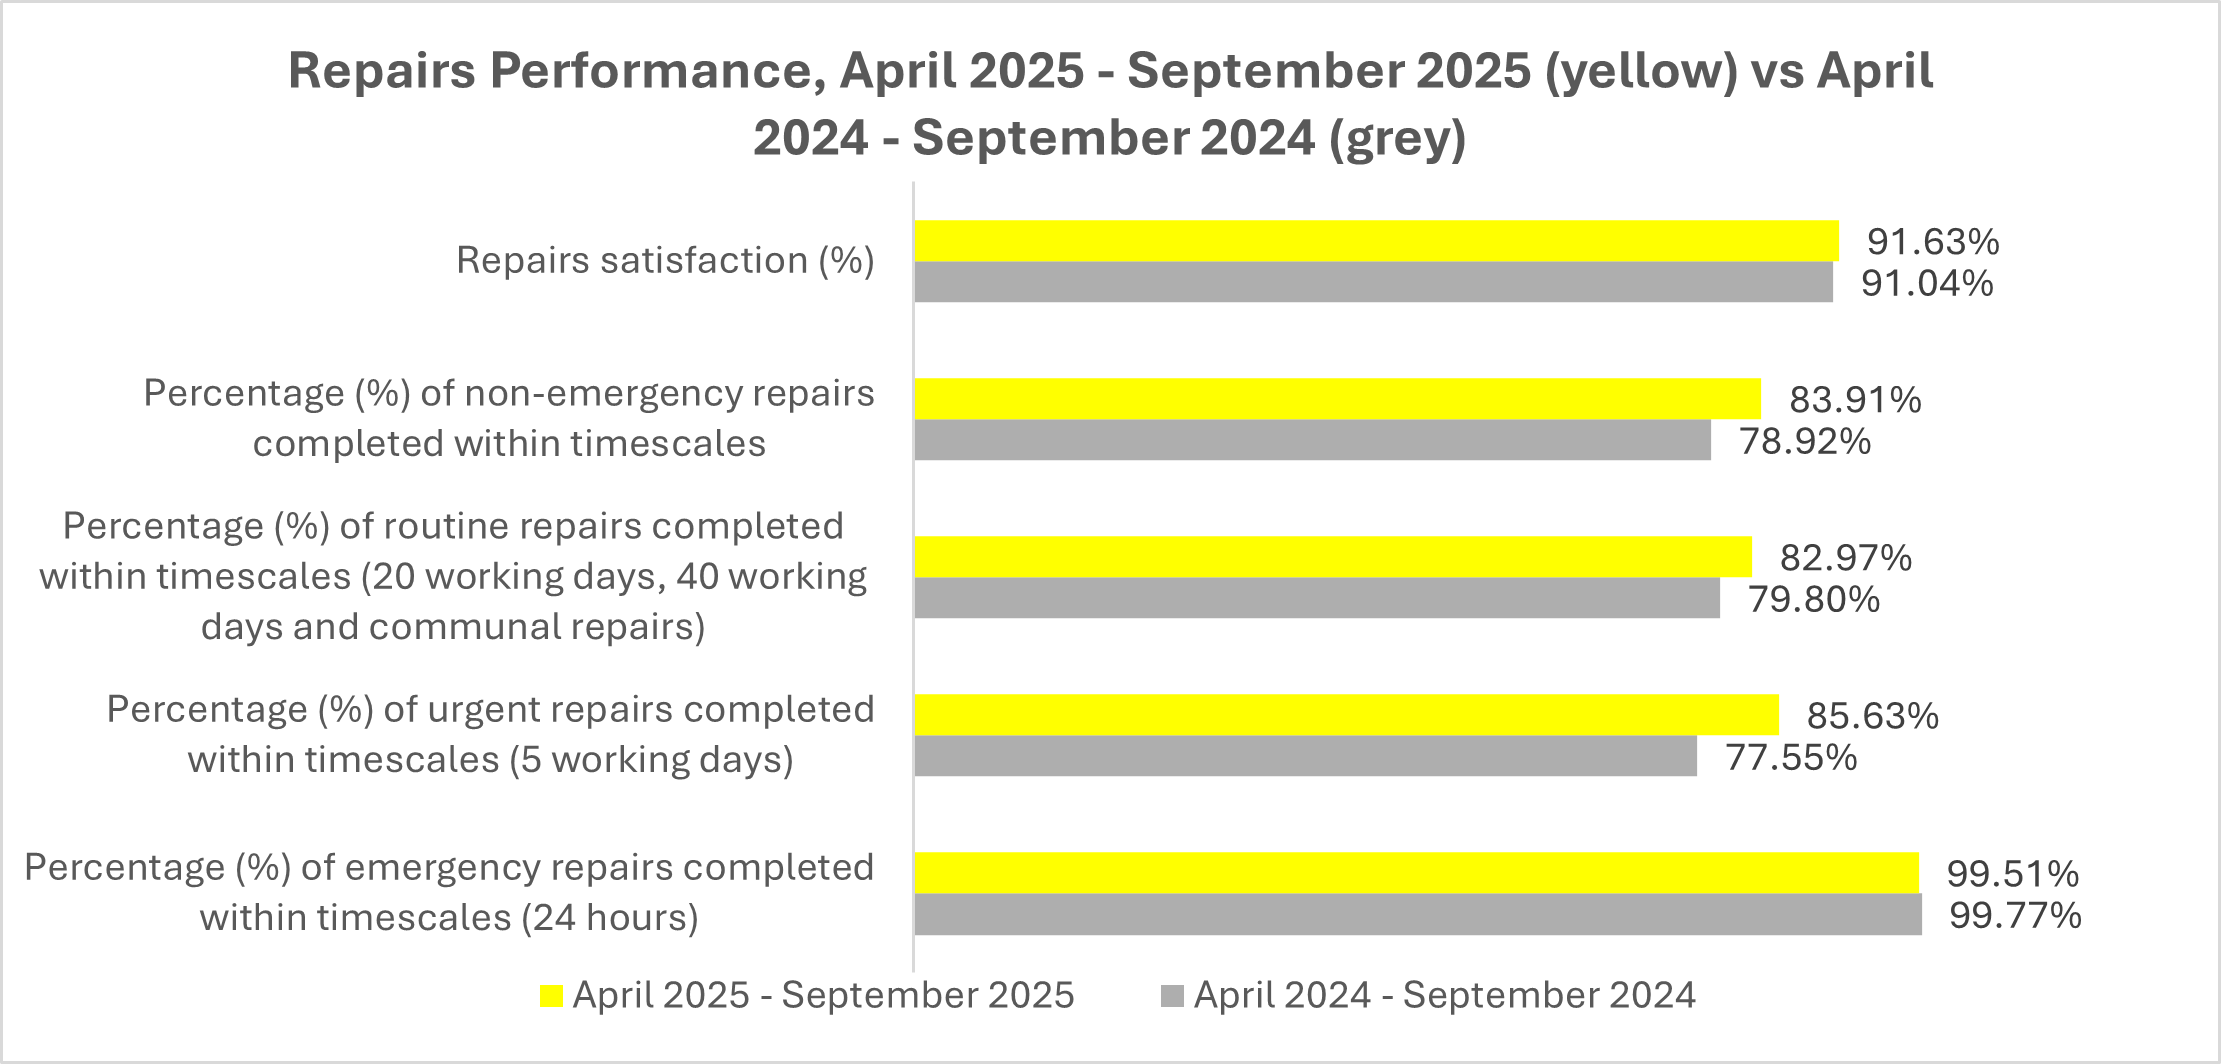
| Repairs satisfaction | 91.6 | 91.0 |
| Percentage of non-emergency repairs completed within timescales | 78.9 | 83.9 |
| Percentage of routine repairs completed within timescales - (20 working days, 40 working days and communal repairs) | 79.8 | 83.0 |
| Percentage of urgent repairs completed within timescales - (5 working days) | 77.6 | 85.6 |
| Percentage of emergency repairs completed within timescales - (24 hous) | 99.8 | 99.5 |
- There has been a slight decline in the percentage of emergency repairs completed within 24 hours (from 99.77% to 99.51%). However, 99.51% is an improvement on the overall performance against the TSMs in 2024-25, when 99.3% of emergency repairs were completed within the target timescale.
- There has been a significant improvement in the percentage of urgent repairs completed within 5 working days (from 77.55% to 85.63%)
- Repairs satisfaction remains high, and is similar to last year, increasing to 91.63%
- Since last year, there has been improvement in the percentage of routine repairs completed within timescales (79.80% to 82.97%) and the percentage of non-emergency repairs completed within timescales (78.92% to 83.91%)
Tenant satisfaction measures (TSMs)
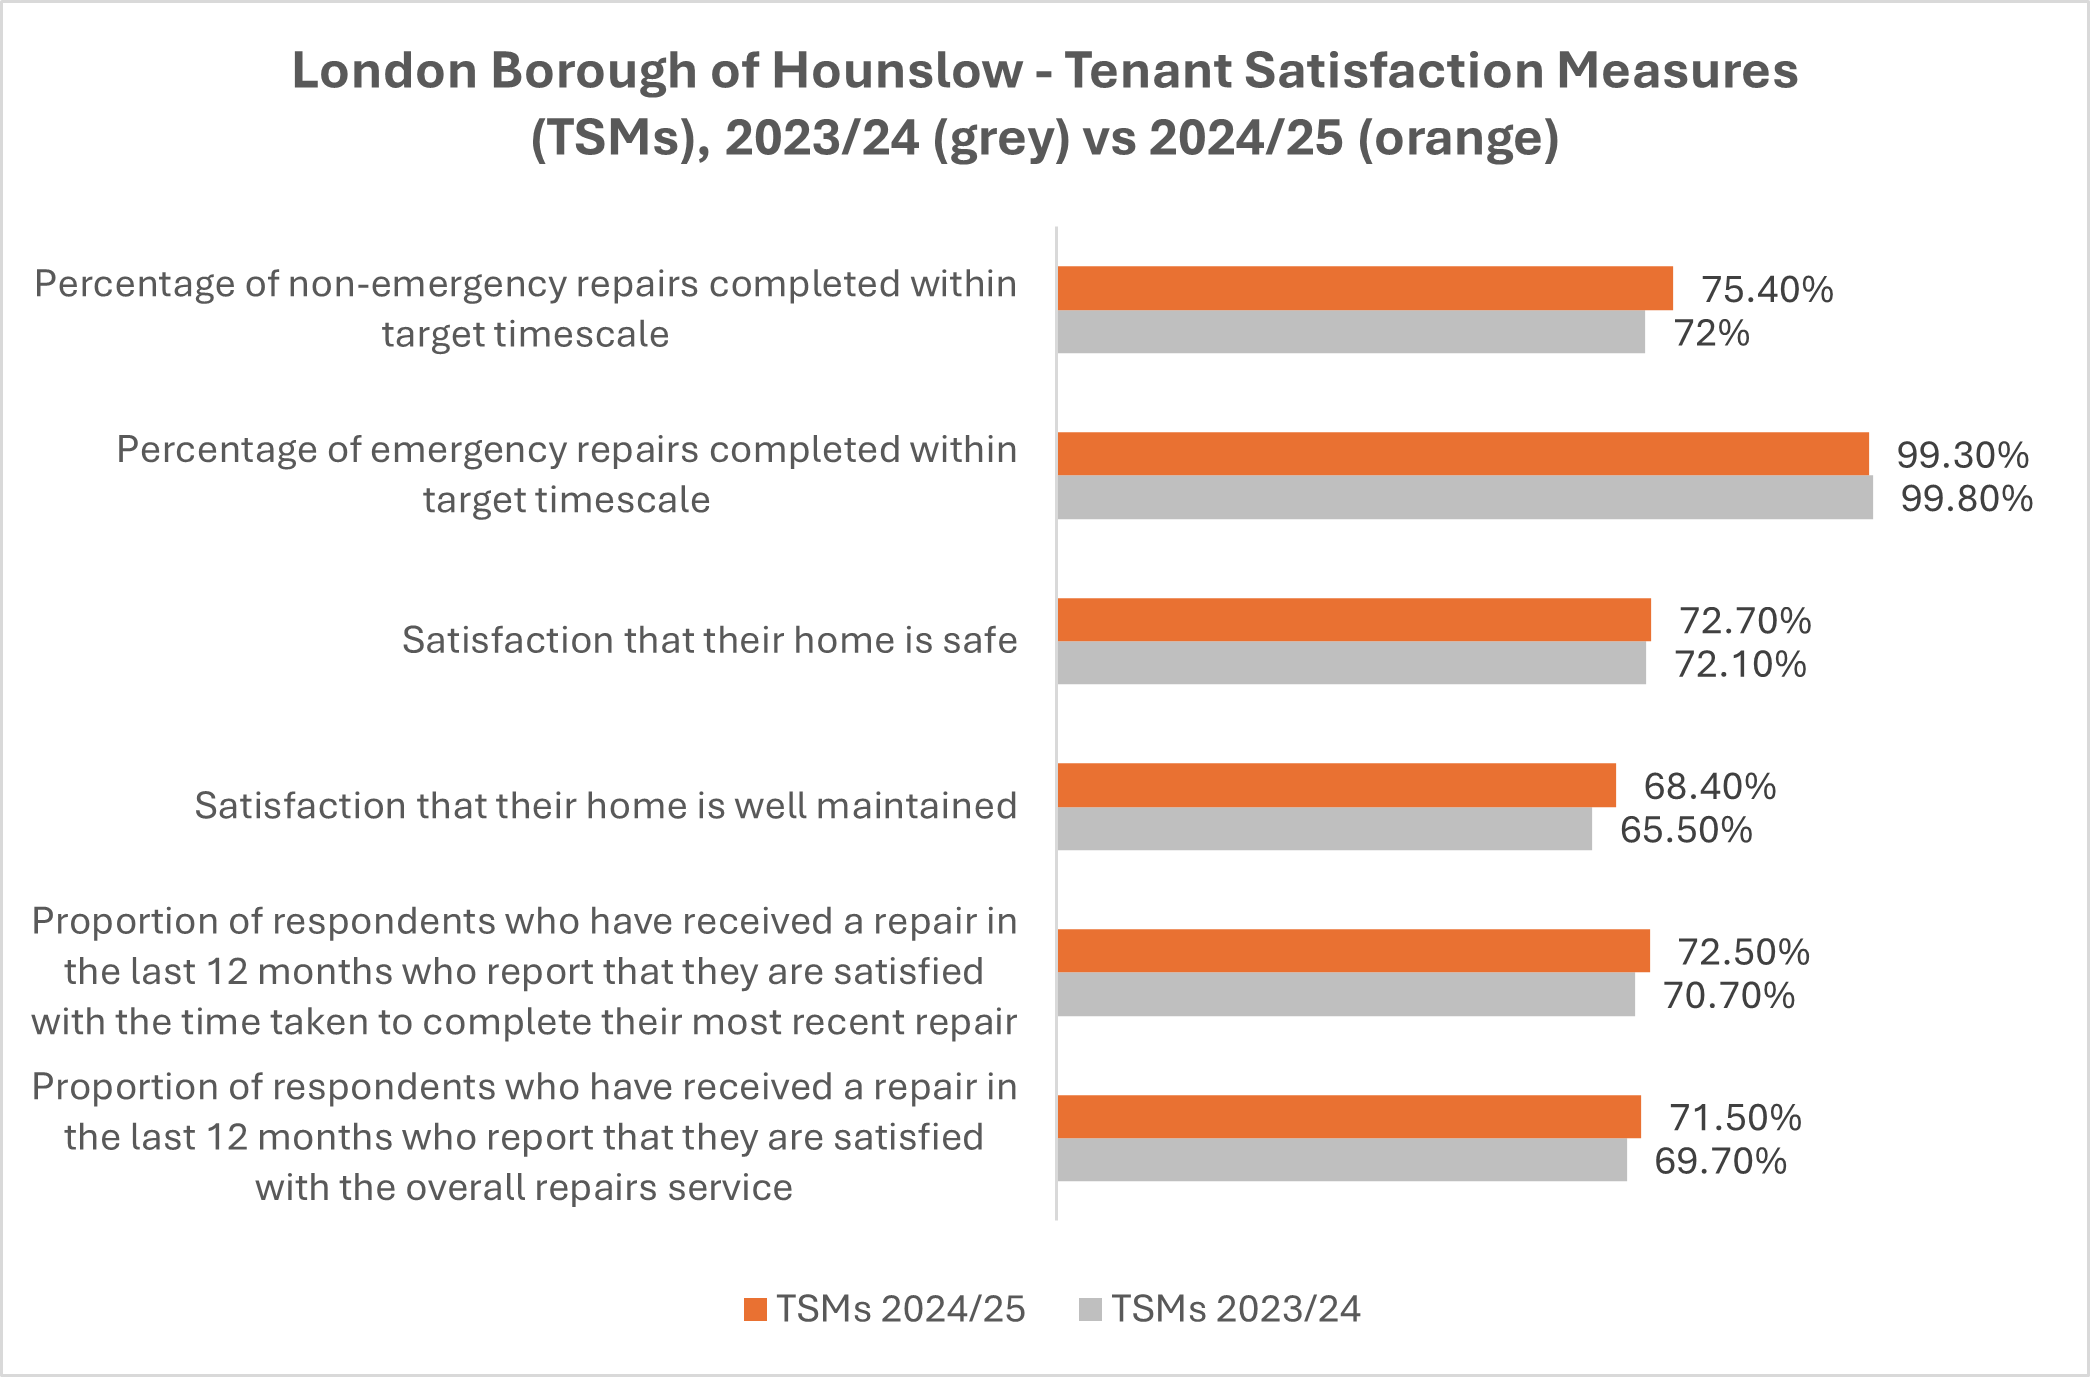
Tenant Satisfaction Measures (TSMs) are performance indicators that track how well social housing landlords are performing in key areas such as repairs, building safety, and tenant engagement. The chart below compares Hounslow’s 2024/2025 TSM Performance against its 2023/24 TSM Performance.
In 2024/2025, the following TSMs had all improved compared to 2023/24. Additionally, for the first three of the following TSMs, Hounslow Council performed in the top 25% of social landlords, according to HouseMark:
- Proportion of respondents who have received a repair in the last 12 months who report they are satisfied with the overall repairs service
- Proportion of respondents who have received a repair in the last 12 months who report that they are satisfied with the time taken to complete their most recent repair
- Satisfaction that their home is well-maintained
- Satisfaction that their home is safe
- Percentage of non-emergency repairs completed within target timescale
| Tenant satisfaction measures |
2023/2024 (%) |
2024/2025 (%) |
|---|---|---|
| Non-emergency repairs completed within target timescale | 72.0 | 75.4 |
| Emergency repairs completed within target timescale | 99.8 | 99.3 |
| Satisfaction that their home is safe | 72.1 | 72.7 |
| Satisfaction that their home is well maintained | 65.5 | 68.4 |
| Respondents who have received a repair in the last 12 months who report that they are satisfied with the time taken to complete their most recent repair | 70.7 | 72.5 |
| Respondents who received a repair in the last 12 months who report that they are satisfied with the overall repairs service | 69.7 | 71.5 |
Housing register waiting times
There is a high demand for council and housing association homes in Hounslow. However, supply is limited. We receive approximately 275 applications for council housing each month. We place applicants in bands 1 to 3 if they are eligible and qualify to join the housing register.
There are over 4,000 households on our waiting list for accommodation. We offer social housing to around two out of ten people on our housing register each year. This means that applicants registered in band 3 are unlikely to receive an offer of accommodation from us. We encourage you to explore other housing options, such as finding accommodation in the private-rented sector.
For applicants in band 2, the waiting times for different sized properties are:
4-bed: 8 to 10 years
3-bed: 4 to 6 years
2-bed: 2 to 3 years
1-bed: 18 to 24 months
Waiting times can vary significantly depending on the type of property you require, for example if you require a wheelchair-adapted property.
The amount of time it takes to let a property once it is Ready to Let (RTL) can vary. In September 2025, we averaged 28 days from Ready to let (RTL) to Let.


